


 Tech & IT
 Business
 Coding & Developer
 Finance & Accounting
 Academics
 Office Applications
 Art & Design
 Marketing
 Health & Wellness
 Sounds & Music
 Lifestyle
 Photography
More Learnfly
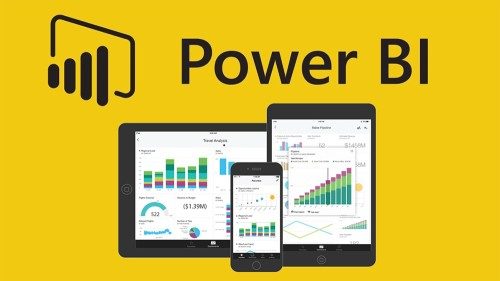
Business Solution Become an InstructorMicrosoft Power BI is one of the most robust business intelligence platforms available. It uses real-time dashboards to sort through and present data from multiple sources, giving businesses a better handle on their customers, operations, and future.
Proficiency in Power BI allows you to create real value for a business, not just gather the numbers. Whether it's a simple Excel sheet or a complicated collection of on-premises data and cloud data, Power BI can sort it all out.
By : Nikolai Schuler
Master Power BI Desktop, Cloud & Mobile and advanced analytics with DAX (also Data Sc...
4.2 4570
7:41:56 hrs 137 lectures All Level
By : Florian Fiducia
Discover, Learn and Customise Power BI reports. Understand the concept in few minutes...
4.1 9496
6:9:47 hrs 189 lectures All Level
By : Vardges Zardaryan
Start from scratch and in 2 hours become an advanced user of Power BI for analysing a...
4.7 69578
2:14:25 hrs 36 lectures All Level
By : Deepesh Vashistha
Create stunning Power BI reports and analyze business data with Hands-on Power BI pro...
4.9 70540
3:35:28 hrs 41 lectures Beginner Level


 Jazeb Akram
 4.2 771160 Beginner Level

 John Hedengren
 4.1 569064 All Level
 Ranjan Pandey
 4.1 346731 All Level

 Muhammad Ahsan Pervaiz
 4.2 101338 All Level

 Pieter Vliegenthart
 4.6 100918 All Level

 Jerome P.
 4.8 100882 All Level

 Senol Atac
 4.9 100093 All Level

 Vikas Munjal
 4.8 100066 Beginner Level
 Avinash A
 4.8 100015 All Level

 Sekhar Metla (Microsoft Certified Professional) Sudha
54 Lectures Beginner Level
.jpg)
 AKHIL VYDYULA
58 Lectures Beginner Level
.jpg)
 AKHIL VYDYULA
50 Lectures Beginner Level

 Biz Facility
 4 Lectures Beginner Level

 Biz Facility
 22 Lectures Beginner Level

 Biz Facility
 5 Lectures Beginner Level
_11zon_(1) (1).jpg)
 AKHIL VYDYULA
5 Lectures Beginner Level

 Pamch Tutor M.Ed
81 Lectures Beginner Level
 Rohidas Kotkar
31 Lectures Beginner Level
 Nikhil Lakhyani
 75 Lectures Beginner Level

20 Lectures Beginner Level
.jpg)
 Nhoeb Khan
46 Lectures Beginner Level
.jpg)
 Fredrick Ezeh
28 Lectures Beginner Level
.jpg)
 Fredrick Ezeh
36 Lectures Beginner Level
.jpg)
 Fredrick Ezeh
59 Lectures Beginner Level
.jpg)
 Fredrick Ezeh
53 Lectures Beginner Level
 Sahil Hasija
17 Lectures Beginner Level

 Prof. M. Higazi
20 Lectures Beginner Level

 AWESOME EMMANUEL
27 Lectures Beginner Level
 AWESOME EMMANUEL
47 Lectures Beginner Level
 Anshuman Tandon
20 Lectures Beginner Level

 Stephen Saxton
66 Lectures Beginner Level
 Anna Clark
60 Lectures Beginner Level

 Kamarthi Karthik
38 Lectures Beginner Level
 Stephen Saxton
36 Lectures Beginner Level

 ISAAC D GOTTLIEB
41 Lectures Beginner Level
 LEMMY FRANCISCO KAWONGA
 85 Lectures Beginner Level
 Stephen Saxton
42 Lectures Beginner Level

 Gerasimos Magoulas
13 Lectures Beginner Level

 Gerasimos Magoulas
10 Lectures Beginner Level

 Binary CodeSoft
 8 Lectures Beginner Level
 Binary CodeSoft
 9 Lectures Beginner Level

 Asif Hafeez
28 Lectures Beginner Level
 Widhi Muttaqien
87 Lectures Beginner Level

 Sarmad Jadoon
 93 Lectures Beginner Level
 Sarfaraz Mohammed
6 Lectures Beginner Level

 Sarfaraz Mohammed
51 Lectures Beginner Level

 AllQuant .
35 Lectures Beginner Level
 LinCademy Training
19 Lectures Beginner Level
 Sekhar Metla (Microsoft Certified Professional) Sudha
135 Lectures Beginner Level
 LinCademy Training
26 Lectures Beginner Level

 LinCademy Training
20 Lectures Beginner Level

 Sanjay Kumar Singh
35 Lectures Beginner Level
 Sanjay Kumar Singh
17 Lectures Beginner Level
 Atul Kadlag
101 Lectures Beginner Level
 Sanjay Kumar Singh
27 Lectures Beginner Level

 Muhammad Ismail
26 Lectures Beginner Level
.jpg)
 Muhammad Ismail
41 Lectures Beginner Level

 Muhammad Ismail
27 Lectures Beginner Level
 Sekhar Metla (Microsoft Certified Professional) Sudha
57 Lectures Beginner Level

 Usama Hassan
27 Lectures Beginner Level

 Rahim Zulfiqar Ali
20 Lectures Beginner Level
 Pradeep Raj
28 Lectures Beginner Level
 Kerron Duncan
81 Lectures Beginner Level

 Paul Eastwood Harris
40 Lectures Beginner Level

 Satyajit Pattnaik
18 Lectures Beginner Level
 Ismaila Omeiza Mumuni
137 Lectures Beginner Level
 Ismaila Omeiza Mumuni
161 Lectures Beginner Level
 Rahim Zulfiqar Ali
46 Lectures Beginner Level
 Theodore Petrou
36 Lectures Beginner Level

 Theodore Petrou
28 Lectures Beginner Level
 SkillsOnDemand .
10 Lectures Beginner Level

 SkillsOnDemand .
12 Lectures Beginner Level

 Satyajit Pattnaik
32 Lectures Beginner Level

 Kathryn Tilley
8 Lectures Beginner Level

 Ahmad Sharifzadeh
45 Lectures Beginner Level
 Kathryn Tilley
12 Lectures Beginner Level

 Amey Karambelkar
20 Lectures Beginner Level

 Junaid Ahmed
70 Lectures Beginner Level
 Bhollamanbhavani
 42 Lectures Beginner Level
 Arthur Fong
39 Lectures Beginner Level

 Namita Devi
22 Lectures Beginner Level

 Arthur Fong
50 Lectures Beginner Level
 Daniel Alexandru Petrescu
15 Lectures Beginner Level
 Daniel Alexandru Petrescu
10 Lectures Beginner Level

 Jan Ekhteyari
70 Lectures Beginner Level
 Rajesh Vydhala
75 Lectures Beginner Level

 Mohammed Marwan
 16 Lectures Beginner Level

 Nikolai Schuler
 137 Lectures Beginner Level
 Kathryn Tilley
6 Lectures Beginner Level

 Jan Ekhteyari
46 Lectures Beginner Level
 Engr. M Khalid Husain .
13 Lectures Beginner Level
 Rajesh Vydhala
23 Lectures Beginner Level
 SkillsOnDemand .
54 Lectures Beginner Level
 Chandramouli Jayendran
158 Lectures Beginner Level

 Jan Ekhteyari
61 Lectures Beginner Level
 Rajesh Vydhala
25 Lectures Beginner Level
 Jan Ekhteyari
72 Lectures Beginner Level
 SkillsOnDemand .
48 Lectures Beginner Level

 Chandramouli Jayendran
24 Lectures Beginner Level
 Chandramouli Jayendran
59 Lectures Beginner Level
 Wesam Qawasmeh
78 Lectures Beginner Level
 Haytham Elmousalami
14 Lectures Beginner Level

 Rahim Zulfiqar Ali
14 Lectures Beginner Level

 Rahim Zulfiqar Ali
12 Lectures Beginner Level
 Juan Galvan
150 Lectures Beginner Level

 Florian Fiducia
189 Lectures Beginner Level

 Prashant Panchal
74 Lectures Beginner Level
 Prashant Panchal
23 Lectures Beginner Level

 Prashant Panchal
16 Lectures Beginner Level

 SRINIVAS REDDY EXCELMAP
45 Lectures Beginner Level
 SRINIVAS REDDY EXCELMAP
65 Lectures Beginner Level
 MEHDI OUMOUSS OUMOUSS
23 Lectures Beginner Level
 Abdelrahman Abdou
119 Lectures Beginner Level

 Ross Maynard
21 Lectures Beginner Level

 Taylor Croonquist
36 Lectures Beginner Level

 Vardges Zardaryan
36 Lectures Beginner Level

 Datahill Solutions
19 Lectures Beginner Level

 Datahill Solutions
11 Lectures Beginner Level
 Gaurav T
5 Lectures Beginner Level

 Anurag Singal
12 Lectures Beginner Level

 Vardges Zardaryan
61 Lectures Beginner Level

 Prof. K Krahenbill
45 Lectures Beginner Level

 Brian Jackson
25 Lectures Beginner Level

 Brian Jackson
7 Lectures Beginner Level

 Brian Jackson
114 Lectures Beginner Level

 Brian Jackson
34 Lectures Beginner Level

 Muhammad Ali Yasin
16 Lectures Beginner Level
 Chip Reaves
70 Lectures Beginner Level
 Daniele Protti
66 Lectures Beginner Level

 Daniele Protti
223 Lectures Beginner Level

 Deepesh Vashistha
41 Lectures Beginner Level

 Phikolomzi Gugwana
25 Lectures Beginner Level
Microsoft Power BI is a business analytics service that enables users to visualize and share insights from their data. It provides interactive dashboards, reports, and data connectors for efficient data analysis.
To create a dashboard, import your data into Power BI, create visualizations using charts and graphs, and pin them to a dashboard. Arrange visuals for a comprehensive view and share the dashboard with others.
Power BI supports a wide range of data sources, including Excel spreadsheets, databases like SQL Server and MySQL, cloud services such as Azure, and various web-based sources. This allows for comprehensive data integration.
Power BI facilitates collaboration by allowing users to share dashboards and reports. You can share with specific individuals or groups, and recipients can interact with and explore the shared data in real-time.
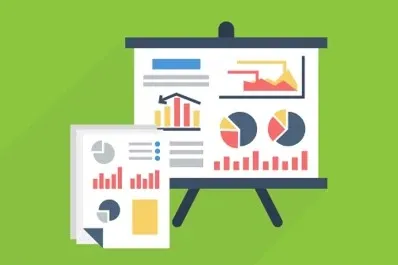
Power BI visuals include charts, maps, tables, and other elements that represent data visually. These visuals enhance data analysis by providing a clear and intuitive way to interpret and understand complex datasets.


