


 Tech & IT
 Business
 Coding & Developer
 Finance & Accounting
 Academics
 Office Applications
 Art & Design
 Marketing
 Health & Wellness
 Sounds & Music
 Lifestyle
 Photography
More Learnfly
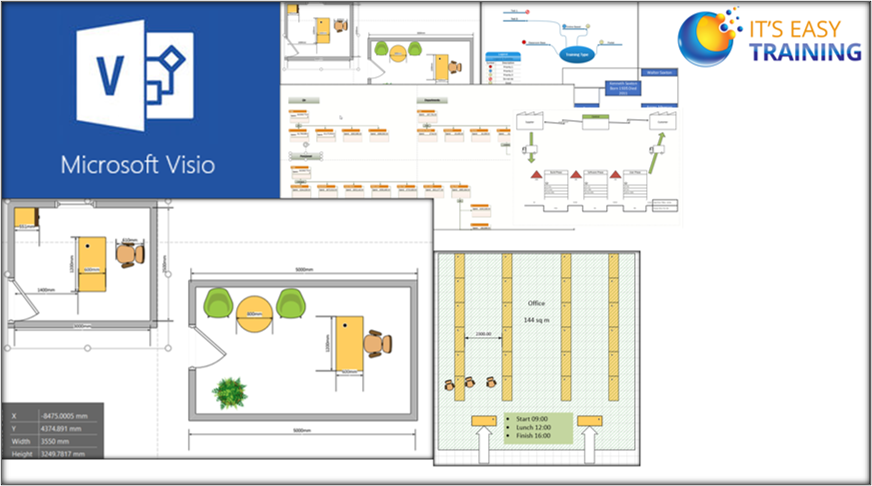
Business Solution Become an InstructorMicrosoft Visio is a diagramming and vector graphics application. It allows users to create visual representations of processes, workflows, and complex information through flowcharts, organizational charts, and other diagrams. Visio aids in conveying complex ideas and structures in a clear and concise visual format.


 Jazeb Akram
 4.2 770987 Beginner Level

 John Hedengren
 4.1 568912 All Level

 Ranjan Pandey
 4.1 346612 All Level

 Muhammad Ahsan Pervaiz
 4.2 101190 All Level

 Pieter Vliegenthart
 4.6 100798 All Level

 Jerome P.
 4.8 100690 All Level

 Vikas Munjal
 4.8 99943 Beginner Level

 Senol Atac
 4.9 99905 All Level

 Avinash A
 4.8 99820 All Level

 Sekhar Metla (Microsoft Certified Professional) Sudha
54 Lectures All Level
.jpg)
 AKHIL VYDYULA
58 Lectures All Level
.jpg)
 AKHIL VYDYULA
50 Lectures All Level

 Biz Facility
 4 Lectures All Level

 Biz Facility
 22 Lectures All Level

 Biz Facility
 5 Lectures All Level
_11zon_(1) (1).jpg)
 AKHIL VYDYULA
5 Lectures All Level

 Pamch Tutor M.Ed
81 Lectures All Level

 Ashis Mondal
31 Lectures All Level

 Nikhil Lakhyani
 75 Lectures All Level


20 Lectures All Level
.jpg)
 Nhoeb Khan
46 Lectures All Level
.jpg)
 Fredrick Ezeh
28 Lectures All Level
.jpg)
 Fredrick Ezeh
36 Lectures All Level
.jpg)
 Fredrick Ezeh
59 Lectures All Level
.jpg)
 Fredrick Ezeh
53 Lectures All Level
 Sahil Hasija
17 Lectures All Level

 Prof. M. Higazi
20 Lectures All Level

 AWESOME EMMANUEL
27 Lectures All Level
 AWESOME EMMANUEL
47 Lectures All Level

 Anshuman Tandon
20 Lectures All Level

 Stephen Saxton
66 Lectures All Level

 Anna Clark
60 Lectures All Level

 Kamarthi Karthik
38 Lectures All Level

 Stephen Saxton
36 Lectures All Level

 ISAAC D GOTTLIEB
41 Lectures All Level

 LEMMY FRANCISCO KAWONGA
 85 Lectures All Level
 Stephen Saxton
42 Lectures All Level

 Gerasimos Magoulas
13 Lectures All Level

 Gerasimos Magoulas
10 Lectures All Level

 Binary CodeSoft
 8 Lectures All Level

 Binary CodeSoft
 9 Lectures All Level

 Asif Hafeez
28 Lectures All Level
 Widhi Muttaqien
87 Lectures All Level

 Sarmad Jadoon
 93 Lectures All Level

 Sarfaraz Mohammed
6 Lectures All Level

 Sarfaraz Mohammed
51 Lectures All Level

 AllQuant .
35 Lectures All Level
 LinCademy Training
19 Lectures All Level
 Sekhar Metla (Microsoft Certified Professional) Sudha
135 Lectures All Level
 LinCademy Training
26 Lectures All Level

 LinCademy Training
20 Lectures All Level

 Sanjay Kumar Singh
35 Lectures All Level

 Sanjay Kumar Singh
17 Lectures All Level

 Atul Kadlag
101 Lectures All Level

 Sanjay Kumar Singh
27 Lectures All Level

 Muhammad Ismail
26 Lectures All Level
.jpg)
 Muhammad Ismail
41 Lectures All Level

 Muhammad Ismail
27 Lectures All Level

 Sekhar Metla (Microsoft Certified Professional) Sudha
57 Lectures All Level

 Usama Hassan
27 Lectures All Level

 Rahim Zulfiqar Ali
20 Lectures All Level

 Pradeep Raj
28 Lectures All Level

 Kerron Duncan
81 Lectures All Level

 Paul Eastwood Harris
40 Lectures All Level

 Satyajit Pattnaik
18 Lectures All Level

 Ismaila Omeiza Mumuni
137 Lectures All Level

 Ismaila Omeiza Mumuni
161 Lectures All Level

 Rahim Zulfiqar Ali
46 Lectures All Level

 Theodore Petrou
36 Lectures All Level

 Theodore Petrou
28 Lectures All Level
 SkillsOnDemand .
10 Lectures All Level

 SkillsOnDemand .
12 Lectures All Level

 Satyajit Pattnaik
32 Lectures All Level

 Kathryn Tilley
8 Lectures All Level

 Ahmad Sharifzadeh
45 Lectures All Level

 Kathryn Tilley
12 Lectures All Level

 Amey Karambelkar
20 Lectures All Level

 Junaid Ahmed
70 Lectures All Level

 Bhollamanbhavani
 42 Lectures All Level

 Arthur Fong
39 Lectures All Level

 Namita Devi
22 Lectures All Level

 Arthur Fong
50 Lectures All Level
 Daniel Alexandru Petrescu
15 Lectures All Level

 Daniel Alexandru Petrescu
10 Lectures All Level

 Jan Ekhteyari
70 Lectures All Level

 Rajesh Vydhala
75 Lectures All Level

 Mohammed Marwan
 16 Lectures All Level

 Nikolai Schuler
 137 Lectures All Level

 Kathryn Tilley
6 Lectures All Level

 Jan Ekhteyari
46 Lectures All Level
 Engr. M Khalid Husain .
13 Lectures All Level

 Rajesh Vydhala
23 Lectures All Level

 SkillsOnDemand .
54 Lectures All Level

 Chandramouli Jayendran
158 Lectures All Level

 Jan Ekhteyari
61 Lectures All Level

 Rajesh Vydhala
25 Lectures All Level

 Jan Ekhteyari
72 Lectures All Level

 SkillsOnDemand .
48 Lectures All Level

 Chandramouli Jayendran
24 Lectures All Level

 Chandramouli Jayendran
59 Lectures All Level

 Wesam Qawasmeh
78 Lectures All Level

 Haytham Elmousalami
14 Lectures All Level

 Rahim Zulfiqar Ali
14 Lectures All Level

 Rahim Zulfiqar Ali
12 Lectures All Level
 Juan Galvan
150 Lectures All Level

 Florian Fiducia
189 Lectures All Level

 Prashant Panchal
74 Lectures All Level

 Prashant Panchal
23 Lectures All Level

 Prashant Panchal
16 Lectures All Level

 SRINIVAS REDDY EXCELMAP
45 Lectures All Level

 SRINIVAS REDDY EXCELMAP
65 Lectures All Level

 MEHDI OUMOUSS OUMOUSS
23 Lectures All Level

 Abdelrahman Abdou
119 Lectures All Level

 Ross Maynard
21 Lectures All Level

 Taylor Croonquist
36 Lectures All Level
 Vardges Zardaryan
36 Lectures All Level

 Datahill Solutions
19 Lectures All Level

 Datahill Solutions
11 Lectures All Level

 Gaurav T
5 Lectures All Level

 Anurag Singal
12 Lectures All Level

 Vardges Zardaryan
61 Lectures All Level

 Prof. K Krahenbill
45 Lectures All Level

 Brian Jackson
25 Lectures All Level

 Brian Jackson
7 Lectures All Level

 Brian Jackson
114 Lectures All Level

 Brian Jackson
34 Lectures All Level

 Muhammad Ali Yasin
16 Lectures All Level

 Chip Reaves
70 Lectures All Level
 Daniele Protti
66 Lectures All Level

 Daniele Protti
223 Lectures All Level

 Deepesh Vashistha
41 Lectures All Level

 Phikolomzi Gugwana
25 Lectures All Level
Microsoft Visio is a diagramming tool in the Microsoft Office suite used for creating diagrams, flowcharts, organizational charts, floor plans, and other visual representations of information and processes.
To create a diagram, open Visio, choose a template or start with a blank drawing, drag and drop shapes onto the canvas, and connect them to represent relationships or processes. Visio provides a wide range of stencils and shapes for various diagram types.
Visio enables collaboration by allowing users to share diagrams with others. Multiple users can work on the same diagram simultaneously, and comments and annotations facilitate communication during the diagram creation process.
Yes, Visio integrates seamlessly with other Microsoft Office applications. You can embed Visio diagrams in Word, Excel, and PowerPoint, enhancing your ability to communicate and share visual representations within different documents.
Microsoft Visio supports data-linked diagrams, allowing users to connect shapes to external data sources. This feature enables automatic updates of diagram elements based on changes in the linked data, enhancing the accuracy and efficiency of data visualization.


